
OBJECTIVE: Given a chromebook with access to the internet as well as access to their Google drive acct, students will research data about their selected country and fill-in a data sheet. This data sheet will be used to build an Infographic on a Poster Board
Given a chromebook with access to the internet, student will record information presented in a powerpoint and fill-in a data chart for the various stages of a "Democratic Transition Model"
RATIONALE: Students need to understand the key population components that are present in each country to understand their challenges as it relates to advancing along the Demographic Transition Model sequence from a lower stage country to a more modern stage country.
Students need to understand the various causes/forces which propel a country along the various stages of economic and social development within a Democratic Transition Model process
EVIDENCE: By filling in the chart, students will become demonstrate the ability to locate specific data from a data packet, translate that data into a graph or chart, and then display that data in an Infographic for easier understanding.
By filling in their chart, students will be able to identify how demographers classify countries along the Demographic Transition Model, and will be able to identify where "their country" (the one they selected as part of the Infographic project) is located.
POPULATION
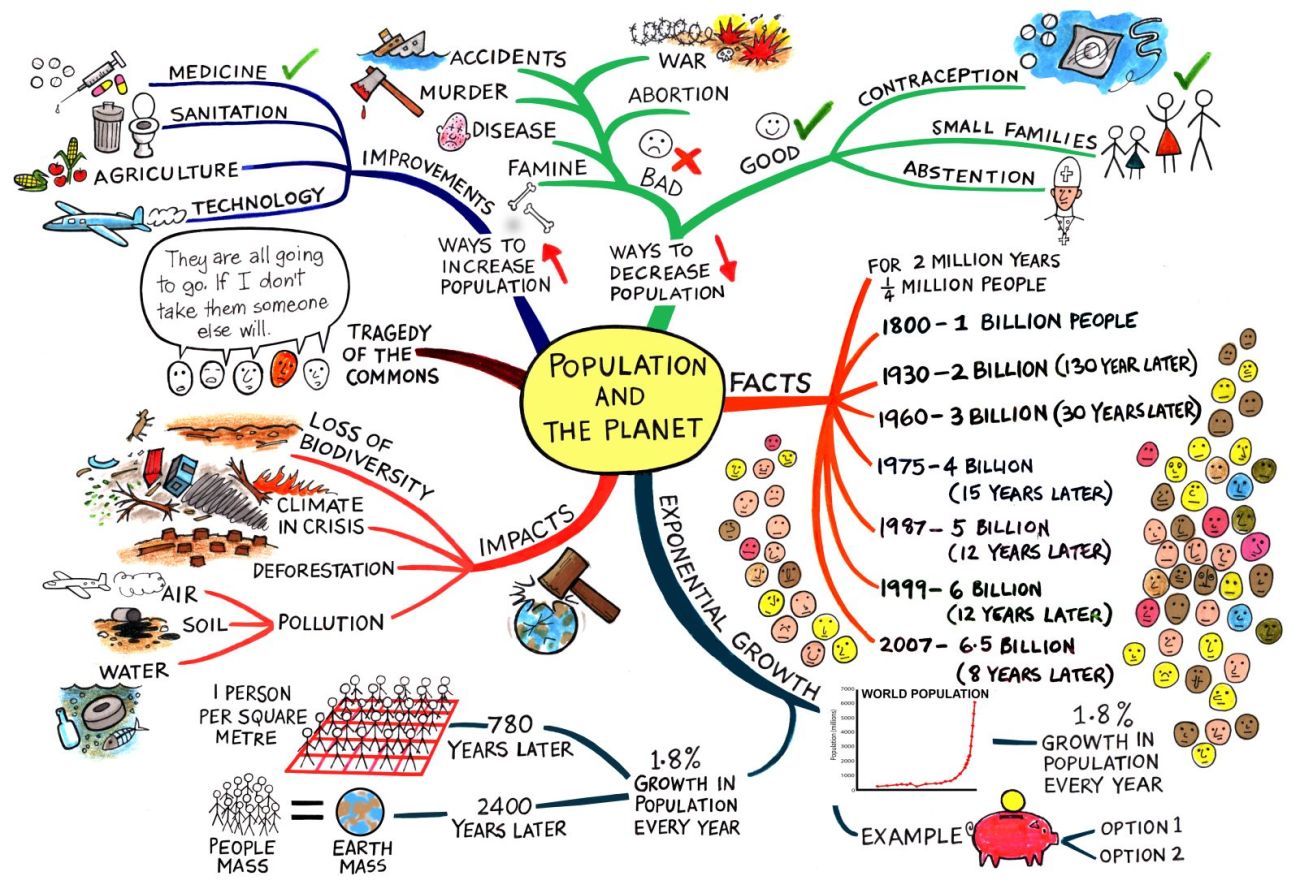
Journal: If the world's current population growth percent would cause famine, starvation, rioting, and general chaos, what rule would you institute to control population growth?
(Devise a law/policy that could be applied to everyone on the earth as it relates to two things: consumption of water and reproduction)
____________________________________________________________________
Today we will start with the Demographic Transition Model Presentation (5)
( Here is a pdf version in case you want to have it on your laptop as I am presenting it) Demographic Transition Model Presentation
INFOGRAPHIC - 16 X 20 (portrait...that means 16 inches wide by 20 inches tall)
Resource to be used to get information for your infographic - World Data Packet
Each student will select a country to create their population pyramid and infographic.
Go to this site and select the country you will be using to complete this project
Infographic Directions Directions Sheet
Sites to create infographics (These are an optional site to create the info graphic)
**Please make a free account on any of these sites and make a Venn Diagram that includes this information. Check list.
Hans Rosling - DTM Stages TED talk
This short video will be followed by a short TED conference video from Hans Rosling about the Population Growing Box by Box - Population Growth Box by Box
Hans Rosling - The Magic Washing Machine
This video explains the various levels of industrialization experienced by various countries"Magic Washing Machine"
Population Causes and Consequences
Copy this article and follow the directions regarding summarizing each paragraph
____________________________________________________________________